Rodolfo Antunes

Revealing Patterns in High Schoolers’ Behavior: EDA and ML for Predicting and Preventing Riding with Drinking Drivers
Project description: In this project we will analyze the risk of high schoolers riding with drinking drivers by examining a dataset from the Youth Risk Behavior Surveillance System (YRBSS) in the U.S. Using Exploratory Data Analysis and Machine learning, we should identify factors contributing to this behavior and use the insights gained to develop preventive measures.
1. Import and Clean data
We should first import the data and perform some basic data cleaning steps, like dropping unwanted columns/null values and renaming columns so that they are more readable.
# Drop the first column that served as an index before
df = df.drop('Unnamed: 0', axis=1)

# Drop null values
df.dropna(inplace=True)

# Rename remaining columns
df.rename(columns={'age4': 'Age'}, inplace=True)
df.rename(columns={'female': 'Gender'}, inplace=True)
df.rename(columns={'grade': 'Grade'}, inplace=True)
df.rename(columns={'smoke': 'Smoker'}, inplace=True)
df.rename(columns={'ride.alc.driver': 'DrunkDriver'}, inplace=True)
2. EDA (exploratory data analysis)
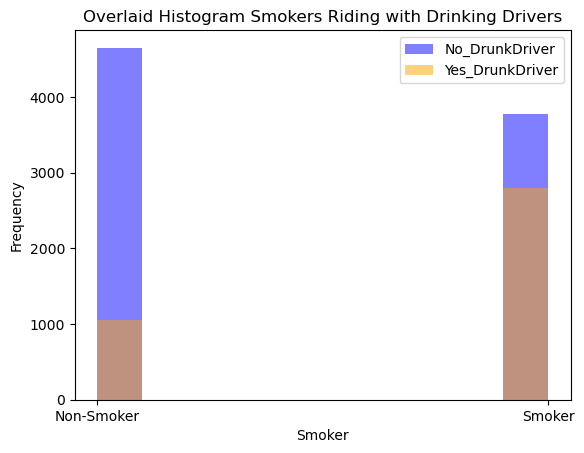
Now we can analyze the distribution of our data per feature, and then take a look at some overlaid plots to see if we can identify some potential differences between the high schoolers that ride with drinking drivers vs the ones that don’t.
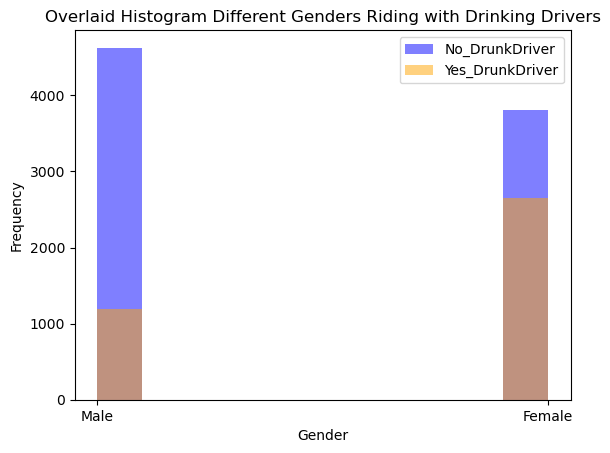
By taking a first look at our data we can definitely see some trends:
• The female students seem to ride more often with drinking drivers
• Smokers also seem to ride more frequently with drinking drivers
• Grade, Age and Having a Driver’s License did not seem to exhibit a different pattern between the passengers of drinking drivers
3. Feature Engineering
Now we can create a new feature to try and make our machine learning models more effective. We can try to see if high schoolers that potentially repeated a school year at some point are at a higher risk of riding with drinking drivers
def check_repeated(row):
    school_year = row['Grade']
    age = row['Age']

    if school_year == 9:
        expected_age = 15
    elif school_year == 10:
        expected_age = 16
    elif school_year == 11:
        expected_age = 17
    else:
        expected_age = 18

    if age > expected_age:
        return 1
    else:
        return 0

df['Has_repeated'] = df.apply(check_repeated, axis=1)
After that, we can check the correlation coefficients to avoid multicolinearity and our p values to see what features we will keep in our ml models
As expected, age, grade and having a driver’s license are highly correlated and should not be added in conjunction to a Machine Learning model. From our EDA it makes sense to keep grade and drop the other two.
4. Create Machine Learning Models
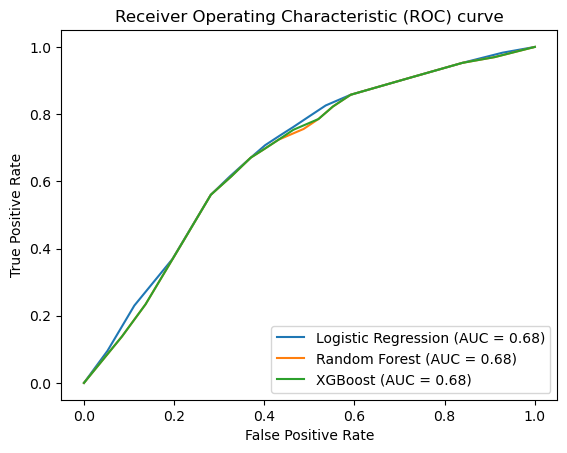
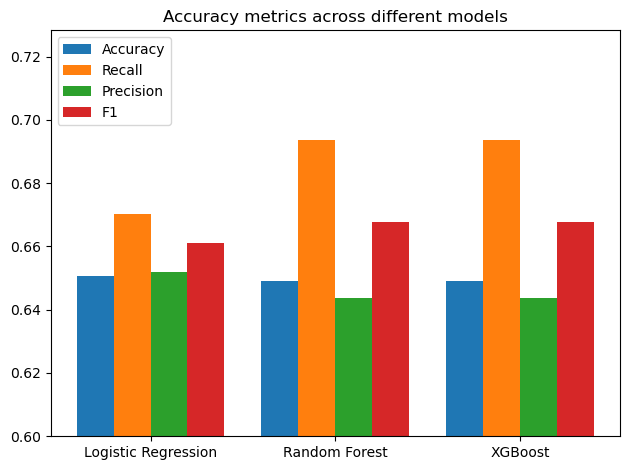
Now we can start our ML models. Let’s first start with Logistic Regression and Random Forest, then we can try XGBoost.
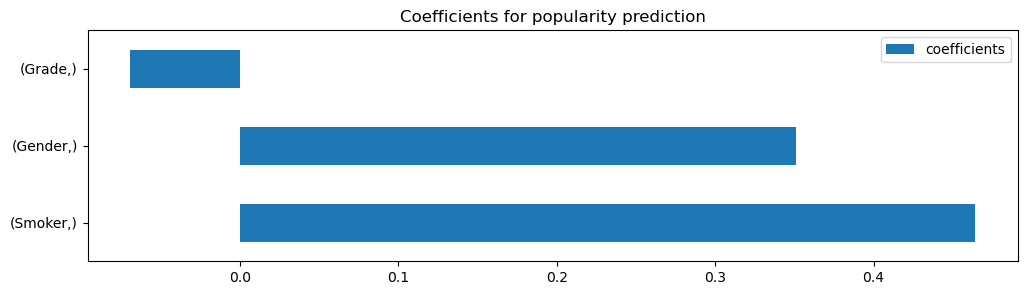 According to our Logistic Regression Coefficients our suspicion from before was correct, the model seems to rely heavily on the features “Gender” and “Smoker” to make its prediction.
However, our Logistic regression model did not perform very well, and our two other models had the same performance. All metrics (Accuracy, Recall, Precision and F1 score) revolved around 65%. This is because we have some limitations due to the dataset that will be addressed in the conclusion.
5. Conclusion, actionable steps and project limitations
Unfortunately, this dataset was not ideal for creating machine learning models. Due to the limited number of features and insufficient data, our progress with this project was restricted.
However, despite these challenges, we were able to draw some meaningful conclusions:
-
Girls tend to ride with drinking drivers more frequently than guys. It is possible that guys tend to be the ones drinking and driving but that is a different topic.
-
Smokers also exhibit a higher tendency to ride with drinking drivers.
-
Differences in age or grade did not appear to have an impact on the likelihood of high schoolers riding with drinking drivers. Other factors may play a more significant role in influencing this behavior among teenagers.
-
Owning a driver’s license did not seem to influence whether or not teens would ride with drinking drivers.
To enhance future projects, the Centers for Disease Control and Prevention (CDC) could consider expanding the questionnaire to include additional relevant questions and also collect more data. After upsampling, our dataset was only able to reach 16,866 rows, which is not enough for a good Machine Learning project.
In conclusion, although the dataset had its limitations, we were able to work with it and derive some potentially valuable insights.
For more details see Project Files